ARLAS CITY
ARLAS CITY
A reliablesolution based upon your data
For harmonious urban development
A public transport system must be reliable, efficient, compact and inter-modal. The fragmentation and complexity of data limit and slow down decision-makers and operators in their task of specifying, designing and improving transport provision.
A cloud solution that aligns data
Data silos are aggregated, reconciled and tuned to provide a detailed, comprehensive and consistent analytical understanding of the network and all its characteristics.
And it leads to good decisions for public transport
Decision-makers and operators have access to three essential understandings of the cities' public transport service: its structure and organisation over time, its operational performance and its use by passengers.
ARLAS CITY
Study the
ARLAS CITY
Study the
package
The whole transport network with all its subtleties at your fingertips.
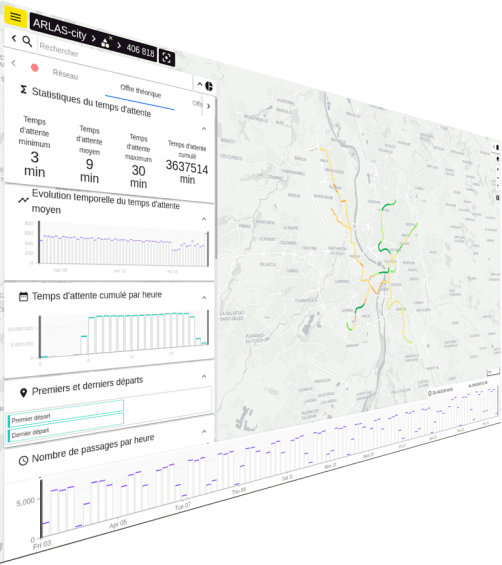
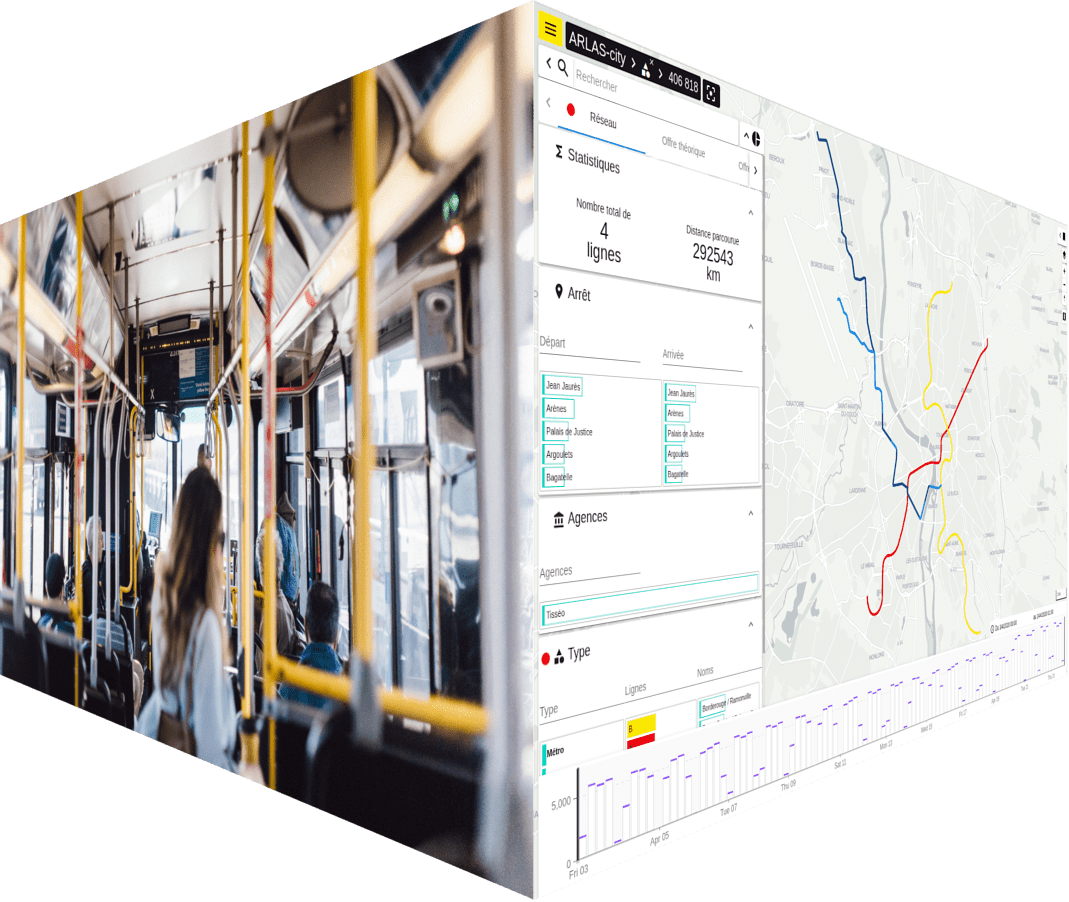
Because public transport services are complex, detailed and made up of millions of inter-stop passages, arlas.city brings a revolutionary geo-analytical experience to capture the major trends and identify the intricacies of the public transport package.
Because public transport services are complex, detailed and made up of millions of inter-stop passages, arlas.city brings a revolutionary geo-analytical experience to capture the major trends and identify the intricacies of the public transport package.
Did you know?
of inter-stop crossings per year for a metro line
of kilometres travelled each year for a metro line


FEATURES
Features
A multi-perspective analysis
arlas.city allows you to analyse and understand the attributes of the transport network from all angles :
Frequencies of time-lapse between stops
Average speeds
Kilometres covered
The first and last departures of each day
But, arlas.city also offers the possibility of unlimited selections for diverse analyses :
:
Selection by polygon or geographical file
Selection and multi-selection by line(s), stop(s), time(s); by hour or by day
Search by text
(ex: "Jean Jaurès Wednesdays")
Selection on the distribution of all the axes
(duration of a section, length of a section, average speed, etc.)
Analysis
Immediately reveal the sections/lines with the highest travelled kilometres.
Demand
Locate the busiest shuttle stops.
Discovery
Spot high-frequency periods instantly.


ARLAS CITY
ARLAS CITY
Measure the performance
All the performances of the network and its components, in detail!
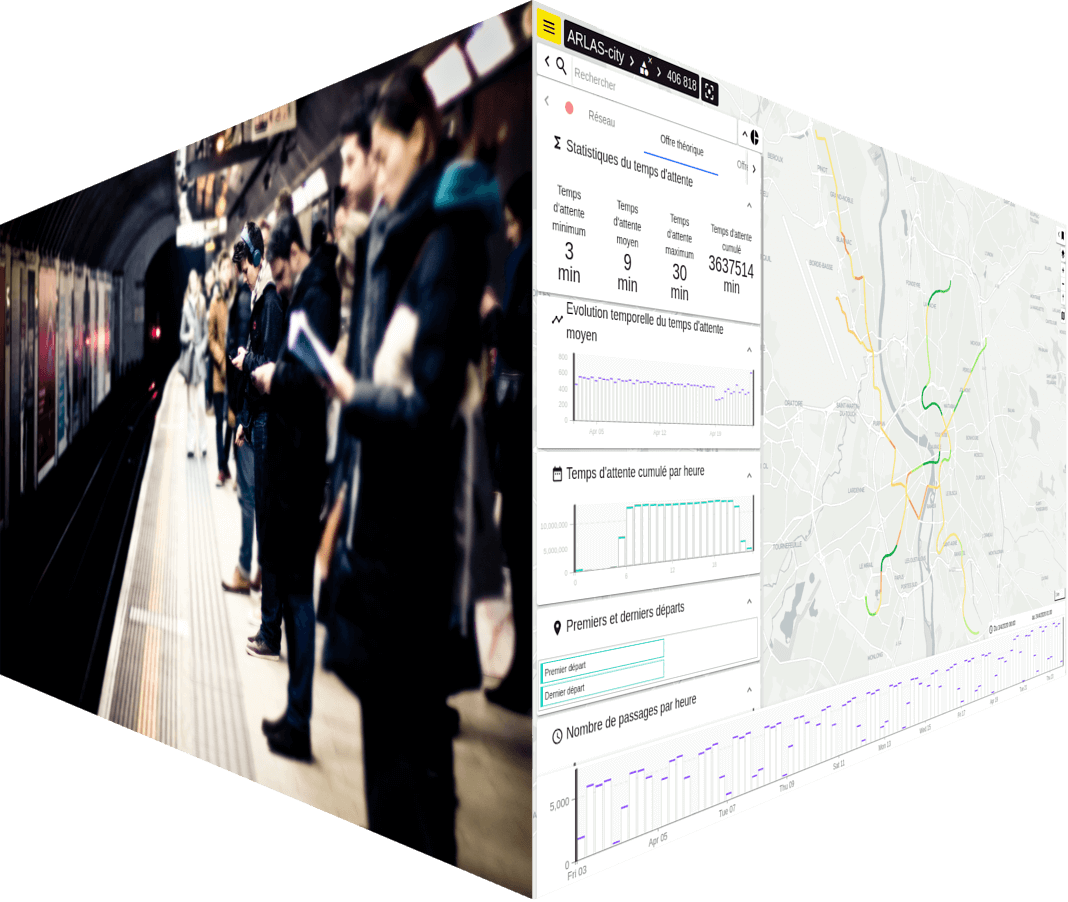
Because improving the network package starts with a global and detailed understanding of its performance, arlas.city provides all the analytical indicators for reliable evaluation of operations of the network and its constituent lines.
Did you know that?
Waiting time of more than 10 minutes at the stops.
INDICATORS
The elements to
INDICATORS
The elements to
measure the performance
arlas.city provides all the indicators related to the operation of the public transport network :
Average delay and accumulated delay
for the network, per line and per stop, per hour and per day of the week
A cartographic visualization
the delay, the number of cancellations and incidents, on average or cumulatively per inter-stop section
The cumulative and average number of passage cancellations
for the network, per line and per stop & per hour and per day of the week
The cumulative and average number of crossing incidents
for the network, per line and per stop & per hour and per day of the week
Analyse
Instantly identify the sections and lines with the most delays.
Discover
Instantly identify the periods that can be problematic.


ARLAS CITY
ARLAS CITY
Understanding the demand
The transport package that responds to the demand!
A transport offer used by citizens is first and foremost an offer that matches the demand with precision.
Did you know that?
of ticket validations on a metro line per year
DATA
data
A precise analysis
With arlas.city, trip validation data will communicate like never before! Even better, it will put the scheduled vs the achieved offer into perspective. You get to know when, where et why :
V/KC
Number of validations per commercial kilometre (V/KC)
Validations on the network
Average and cumulative number of validations for the network, per line and per stop
Validations over time
Average and cumulative number of validations per hour and per day of the week.
Cartographic visualization
Average or cumulative number of validations per inter-stop section.
Analysis
Instantly identify the sections and lines that generate traffic and those that are under-used.
Trends
Instantly pinpoint periods of high demand and low demand.
ARLAS CITY
ARLAS CITY
Widely open to data and to third-party services !
The cloud solution based on open source technology (arlas.io) is open to its ecosystem and GTFS transport data.
Secure
The arlas.city cloud solution has highly adaptable admin functions to mange multiple user's parameters.
Accessible
The arlas.city cloud solution includes the theoretical offer to the GTFS formalism, an open, accessible format.
Visual
The solution offers a graphical interface that speaks to everyone, focused above all on cartography.
Reusable
arlas.city offers REST services and exhibits OGC (Open Geospatial Consortium) services.
ARLS CITY
Get started with arlas.city Community,
ARLAS CITY
Get started with arlas.city Community,
the first month of the trial is free !
A cloud solution that is worth a try!


